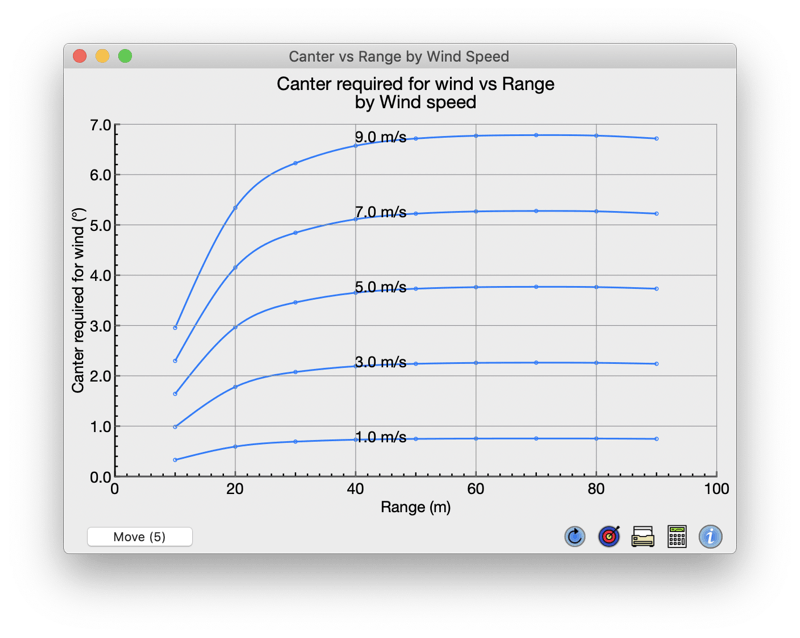
This window is opened by the Analysis>Parametric Plots panel's Plot Window button. It displays a parametric plot of generated data.

The presence of this window can have significant impact on the functioning of the calculator due to the heavy load in generating some data types. It is recommended that most other FlyingSticks windows be closed when using this window in conjunction with the Analysis>Parametric Plots panel.
The Auto Run checkbox on the Analysis>Parametric Plots panel defaults to checked, but this can lead to sluggish response due to the heavy work-load. Unchecking cause the window to only be updated when the Analysis>Parametric Plots panel is visible.
This button moves the trace labels (that show the trace's control variable's value) to different positions. Select for the best readability. The number in brackets is the position number that can be used in scripting as the initial position of the labels.

Forces a recalculation of the plot data. This can be helpful when plotting some types of numerically generated statistical data such a round scores as it can give a feel for the amount of variability. It can help in deciding if the precision check box should be activated in the Analysis>Parametric Plots panel.


Opens the standard print dialog from where the plot area may be forwarded to a printer or saved in PDF file as vector graphics for other uses or for later printing.
When saved as a PDF and subsequently opened in "Preview" (the Mac's default PDF viewer) the plot may be converted to other high resolution image formats.
Before printing, optimize the plot for best appearance by changing the limits, the number of points and the label position, the plot size and its aspect ratio.

Changes the calculator to the Analysis>Parametric_Plots panel from where the parametric plot can be modified.

Opens this information popup. Similar buttons are to be found on various calculator panels and provide context related information. The panel may be dragged to another place on the screen and left open until another Info popup is opened.